Publish with us

Follow Penguin

Follow Penguinsters

Follow Hind Pocket Books

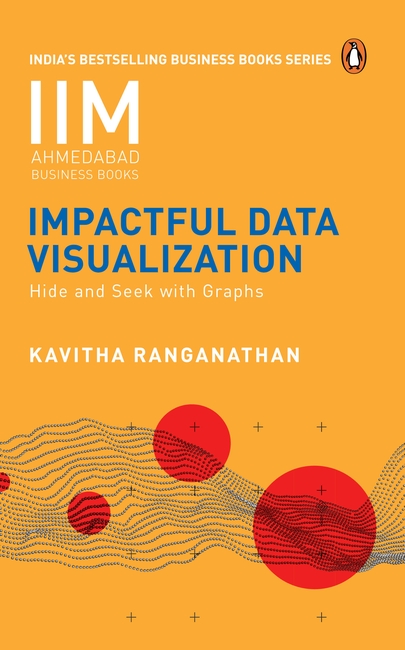
Impactful Data Visualization

Impactful Data Visualization

Hide and Seek with Graphs

Kavitha Ranganathan
Select Preferred Format
Buying Options
Paperback / Hardback

Water, water, everywhere, nor any drop to drink,
Data, data, everywhere, no time to stop and think!

There is scarcely a role that does not require us to understand, analyse and present data. Charts, graphs and maps are everywhere. However, many of these data visuals leave the viewer bewildered, confused or (even worse) with an incorrect understanding of the data. In contrast, if designed well, data visualizations help us make sense of data and communicate our insights better.

Bringing her clear classroom-teaching style, which has helped hundreds of data wranglers, to this book, the author walks you through the myriad ways that graphs can mislead, helping to spot visualization traps and prevent misinterpretations. She illustrates core design principles for creating truthful and effective data visualizations, assisting you to master the art and science behind creating impactful and accurate graphs. Packed with examples to clearly explain the dos and don’ts of data visualization and backed by empirical research, this book will transform the way you create and analyse graphs and charts.

Imprint: Penguin Business

Published: Jun/2023

ISBN: 9780143461746

Length : 196 Pages

MRP : ₹499.00

Impactful Data Visualization

Hide and Seek with Graphs

Kavitha Ranganathan

Water, water, everywhere, nor any drop to drink,
Data, data, everywhere, no time to stop and think!

There is scarcely a role that does not require us to understand, analyse and present data. Charts, graphs and maps are everywhere. However, many of these data visuals leave the viewer bewildered, confused or (even worse) with an incorrect understanding of the data. In contrast, if designed well, data visualizations help us make sense of data and communicate our insights better.

Bringing her clear classroom-teaching style, which has helped hundreds of data wranglers, to this book, the author walks you through the myriad ways that graphs can mislead, helping to spot visualization traps and prevent misinterpretations. She illustrates core design principles for creating truthful and effective data visualizations, assisting you to master the art and science behind creating impactful and accurate graphs. Packed with examples to clearly explain the dos and don’ts of data visualization and backed by empirical research, this book will transform the way you create and analyse graphs and charts.

Buying Options
Paperback / Hardback

Kavitha Ranganathan

Kavitha Ranganathan is a faculty in the information systems area at the Indian Institute of Management Ahmedabad (IIMA). She holds a master's degree and a PhD in computer science from the University of Chicago and a master's degree in information systems from BITS, Pilani.

Kavitha has been teaching data visualization courses to MBA and doctoral students, analytics professionals and in a wide range of corporate training programmes for more than a decade now. She draws from this vast and rich experience for her book, which captures the main principles for avoiding misleading graphs and creating effective and intuitive visualizations.

Kavitha lives in Ahmedabad with her husband, their two kids and Coco, the youngest furry canine addition to the family. Whenever she gets a free moment, Kavitha can be found walking around the IIMA campus, admiring the many species of trees and birds in this gorgeously green oasis.

error: Content is protected !!